Who rules the Internet: cats or dogs?
1) Data generation
For the first part of this exercise, I want to you have a crack at creating some data that you can use.
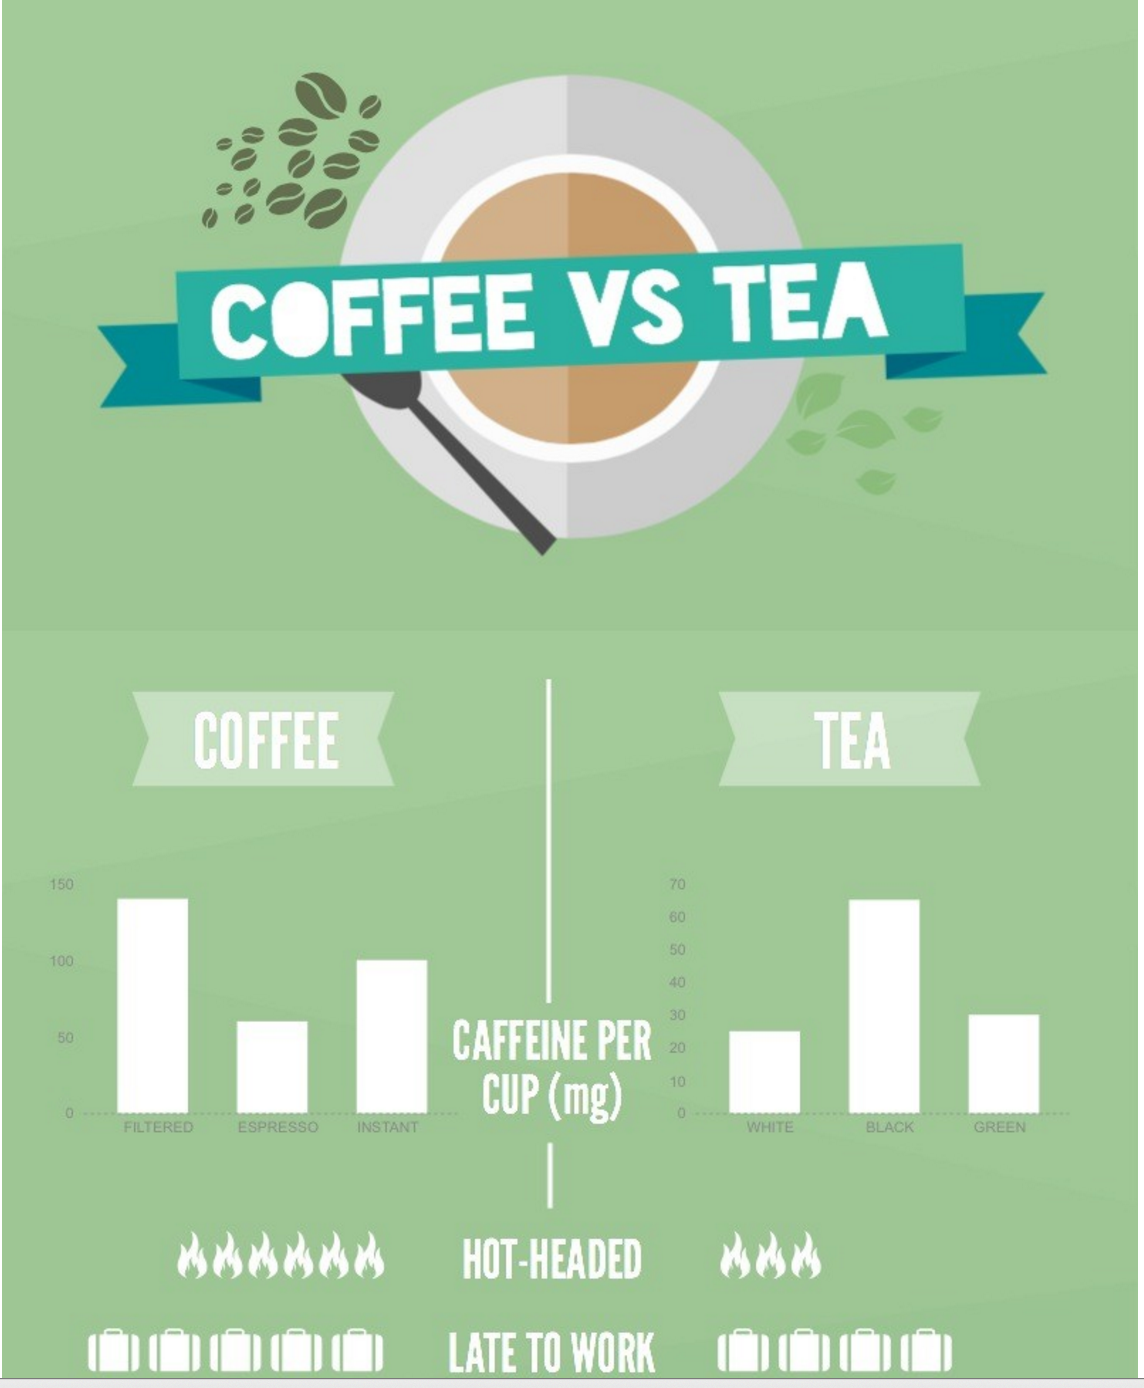
Here’s a great article on Digital Trends that uses some Internet metrics to see who really rules the Internet, dogs or cats. The first part of the article uses search stats to compare on a variety of media, such as: Data tools: Google search trends cats vs dogs
In this analysis, the dogs come out ahead, quite clearly.
The second part looks at individual dogs and cats. This suggests the cats win, but it just uses one example on Facebook, and it depends on the metric you use. (Likes vs people talking about the page.)
Here’s a list of famous Internet dogs. Here’s a list of famous Internet cats.
Use these lists and the article to come up with at least three comparisons.
2) Wireframe It!
Get out some paper and have a quick go at what you’d like to present. Some other cat vs dogs infographics to get you thinking.
The layout cheat sheets on Piktochart may help with drawing your wireframe.
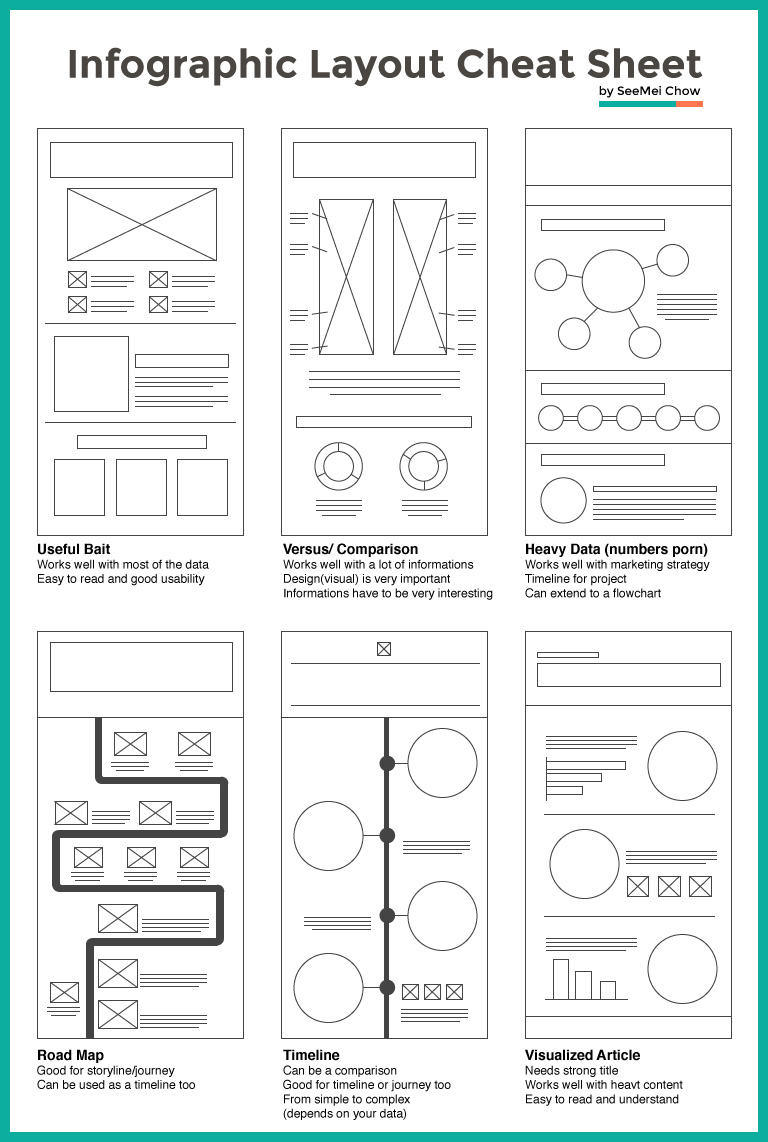
3) Use Piktochart to design your infographic
You can use a pre-set template or use the blank one. Look for something that will help you make the comparison. (This one is no longer free, but it gives you the idea.)
4) Upload
When you’re done, embed it in your home page, or include a new page and link to it from your home page.